Case Study: BMO Radicle Dashboard
Dashboard Project Overview
| Role | Senior Product Designer |
| Description | Designing a client dashboard based on an pre-planned product vision |
| Problem To Solve For | With carbon credit generating applications taking years to complete, clients had difficulty getting updates and insights on the progression of their application. |
| Goal | Provide a platform or what Radicle called a 'Dashboard', to allow better communication and transparency into the state of their application process. |
| Challenges | The dashboard also had to provide a way for clients to provide any necessary documentation or evidence to the service providers as the application progressed. This added complexity since this opened up a door to a new user, the service providers. With documentation being submitted, there had to be a way for the service providers to review and approve or reject the documentation. The back and forth communication between the two personas complicated the product requirements and functionality. To add to the challenge, the feature that allowed service providers to review documents was added to a legacy product. The limitations of this older product created constraints that we had to creatively navigate as a product team. |
| Learnings | Learned to express my concerns over the product strategy and direction in a proactive manner with research and data-driven information, while ultimately advocating for a better service and product experience for our users. |
| Tool(s) | Miro, Figma |
Workflow 1: Client dashboard and evidence upload experience
After working with the UX researcher to understand the personas she had identified, I aimed to create a dashboard that allowed clients to have an overview of their submitted assets for credit generating. Key information would be communicated for each asset - a unique identifier to distinguish assets from each other, the state of the asset, and the phase the asset is in within the credit generating process.
1. Displaying the right information to better track assets
Clients can have hundreds to thousands of assets. To help navigate and track these assets, I grouped them by surface location, provided filters, and search capabilities to help clients find a single asset to a group of assets within a certain location.
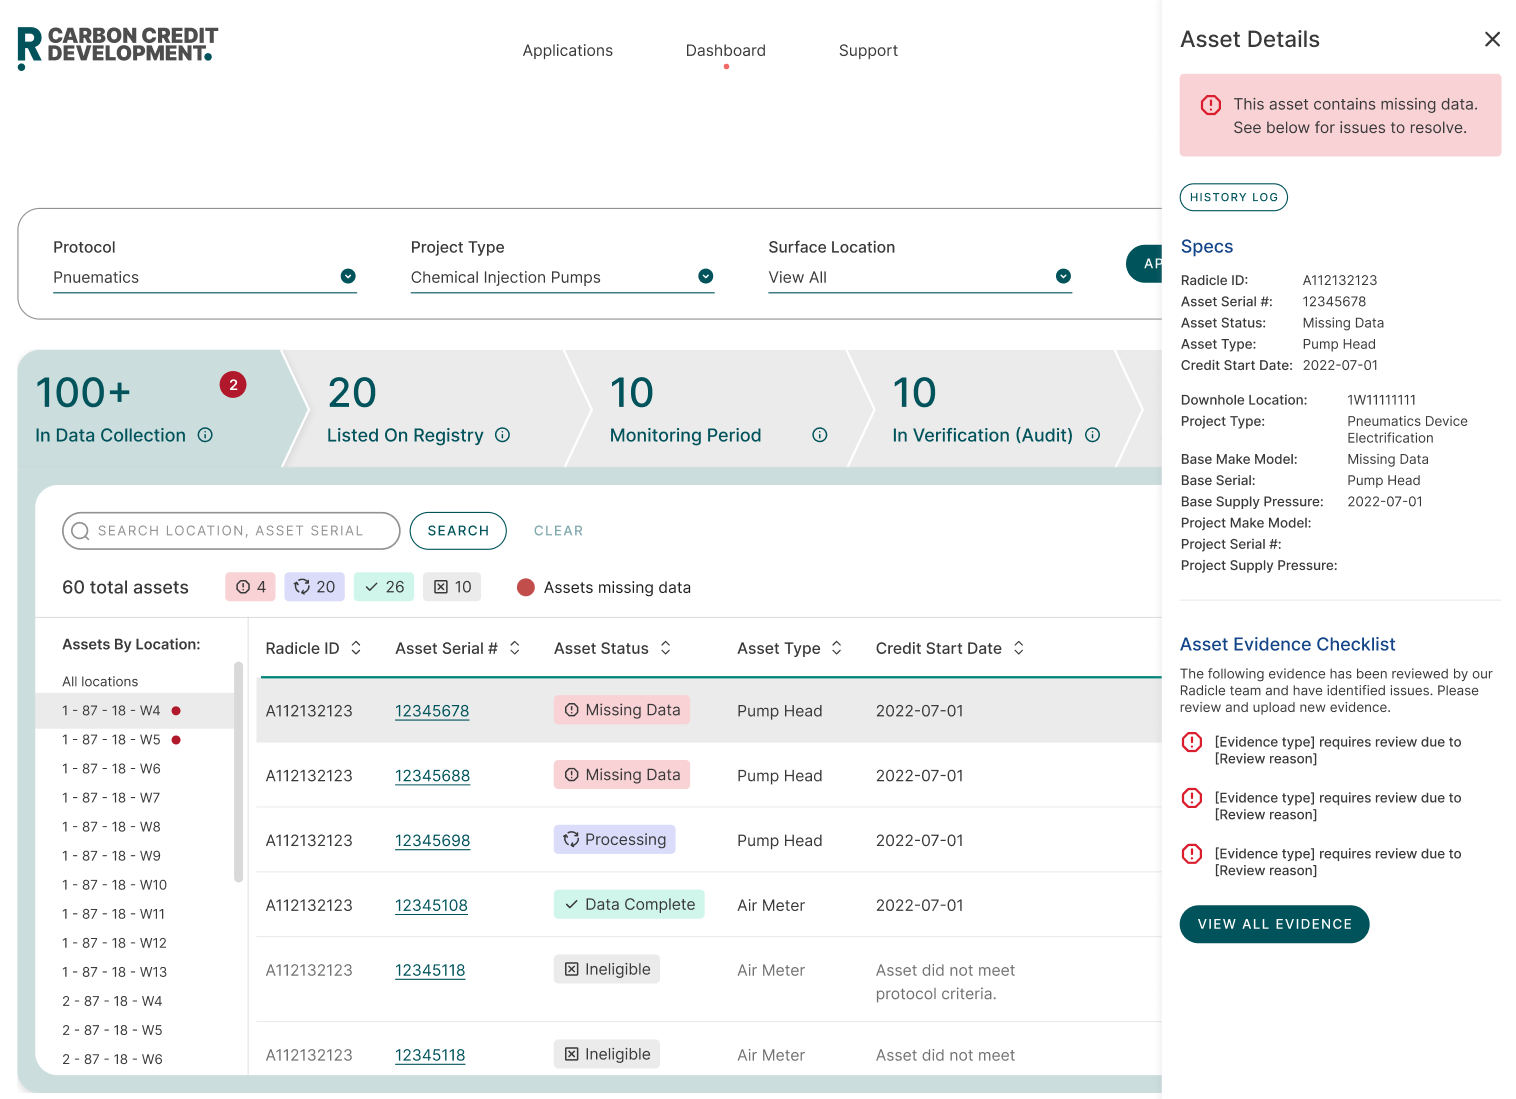
2. Managing missing or problematic evidence for assets
One of the major road blocks that delay assets from generating credits is the lack of evidence or documentation that an asset is meeting audit standards. When service providers identify missing data or problems with evidence, the communication and tracking of the evidence can become difficult. With the dashboard, I added in an Asset Details side sheet that provides a checklist to show what evidence is missing, why it's a problem, and a way to upload new evidence. This side sheet is displayed whenever a single asset is selected within the table.
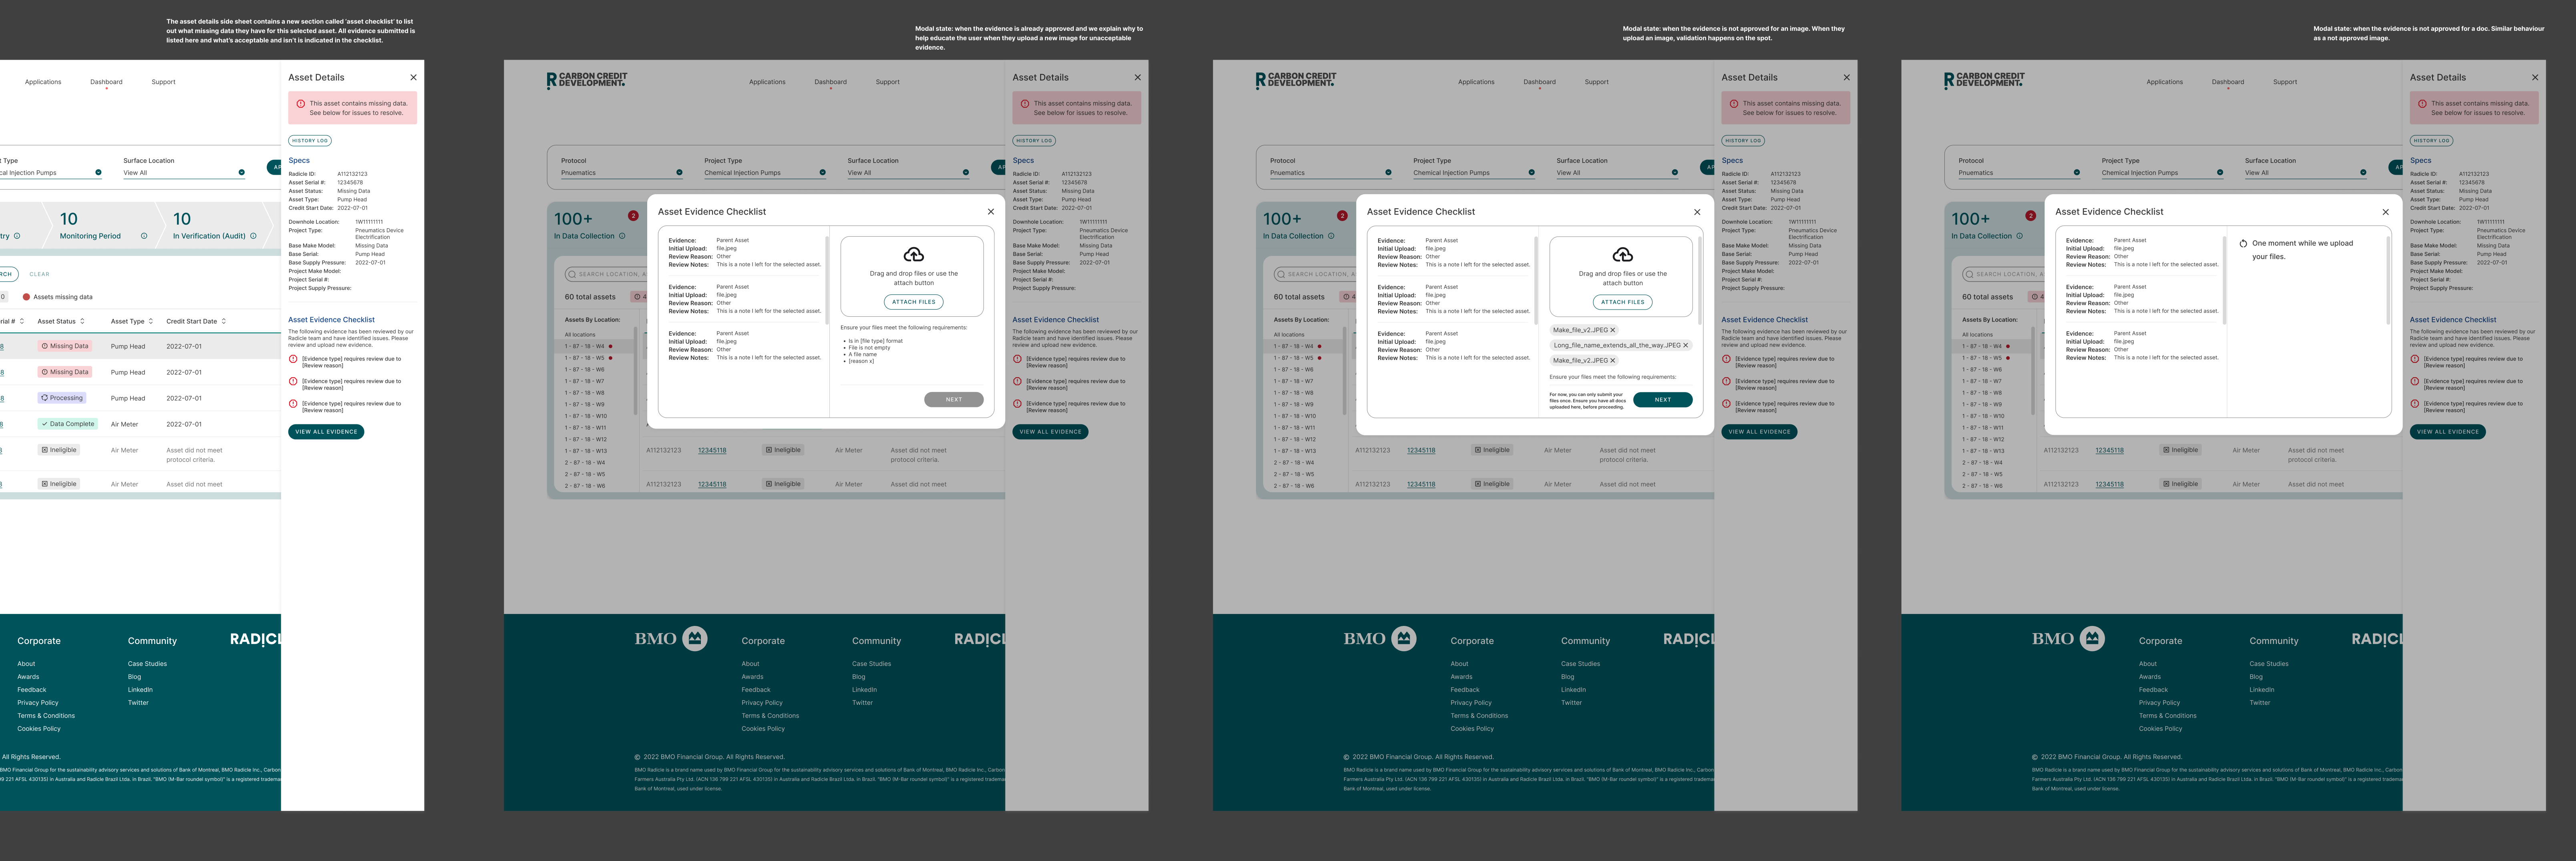
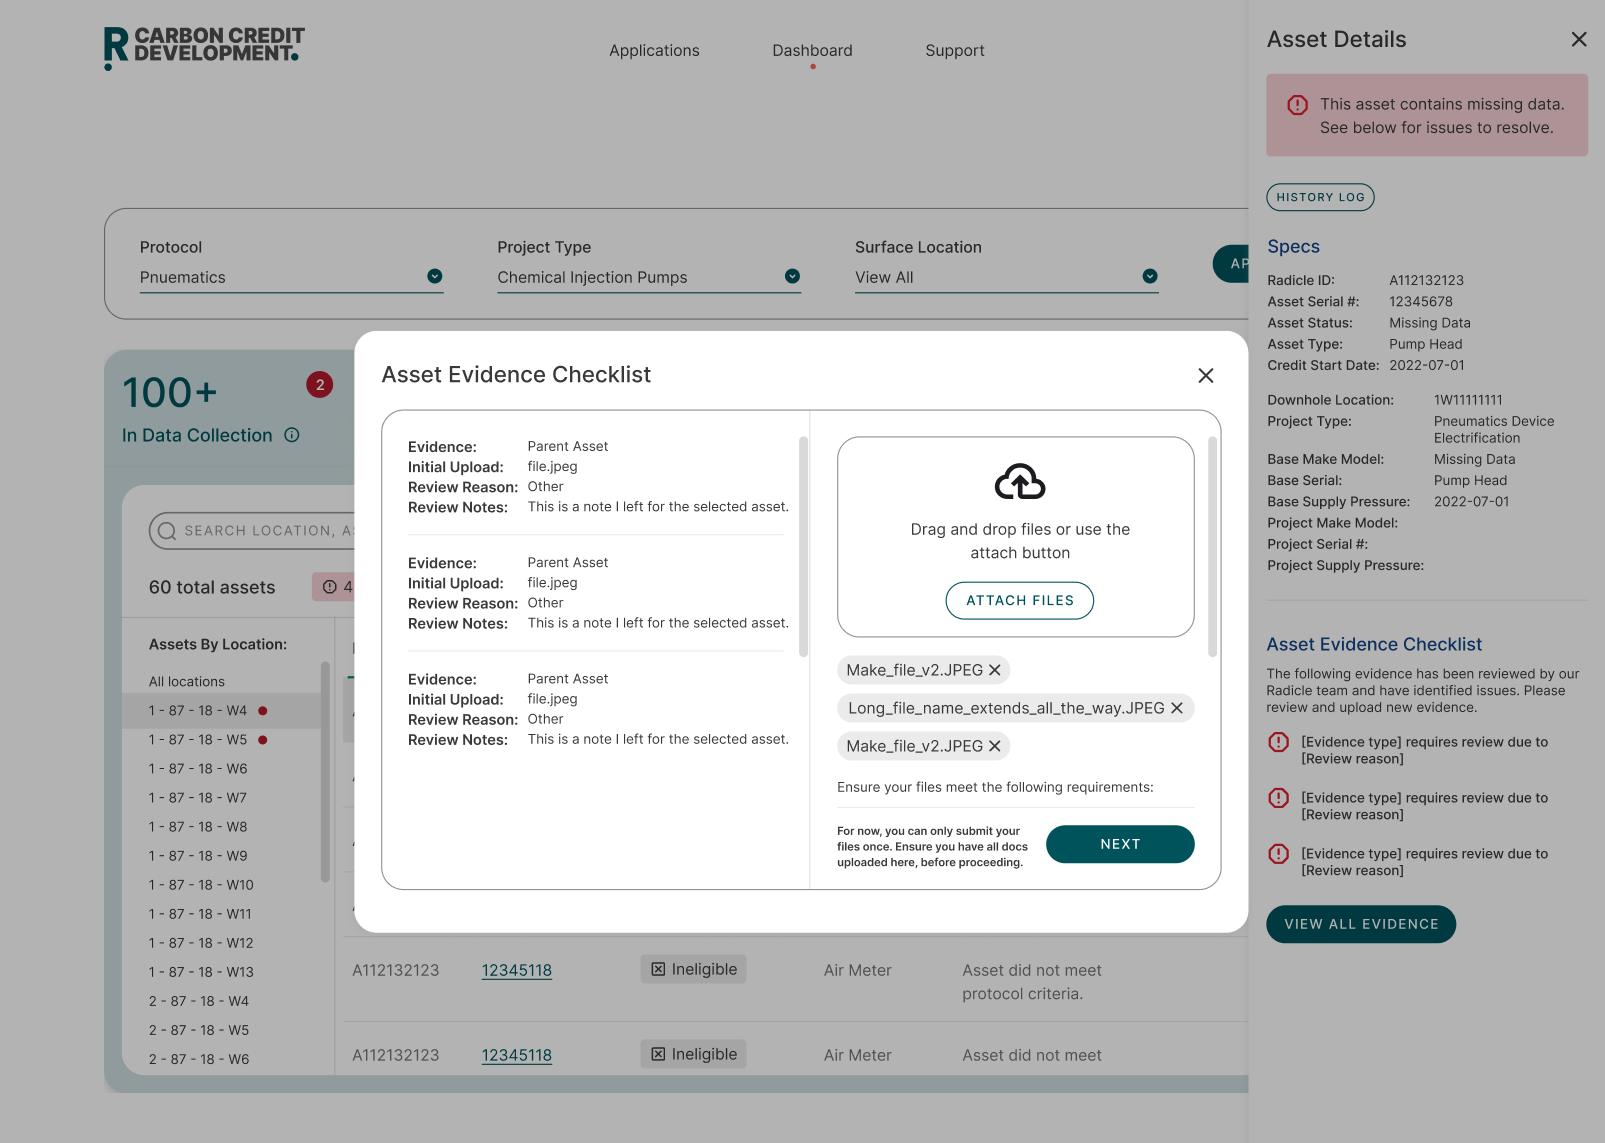
3. Accounting for all the different steps, actions and states within the workflow
While designing this new workflow, I looked to anticipate possible outcomes or scenarios with every action, the potential states of each action (load, success, error), and communicating to clients how to navigate errors if they do arrise.