UI: StellarAlgo
Data Visualization
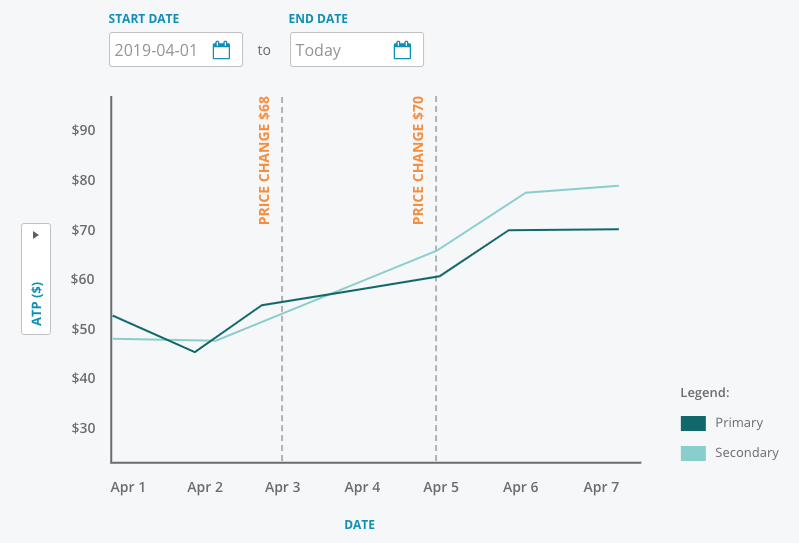
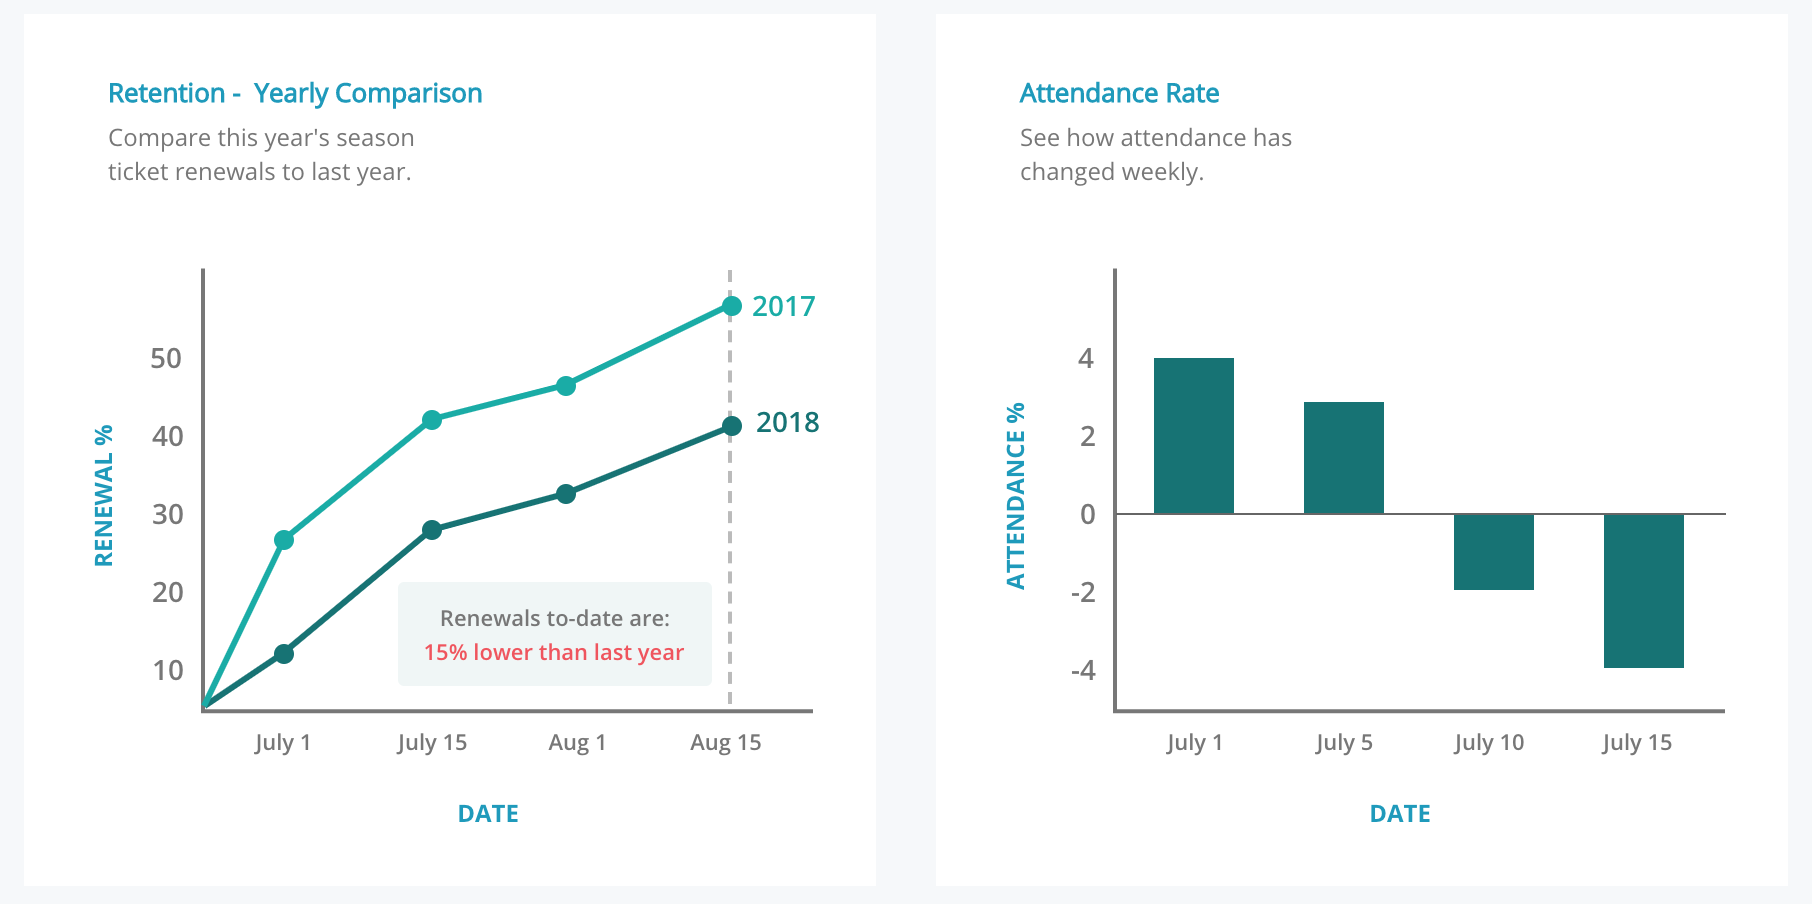
Exploring different graph options to display data in a meaningful way. To find the best way to visualize data, I had to understand what the data was used for, what their goal(s) were and what actions they would take with the provided data.


